Principal application-layer developer v1.2 + v2.0
Full experiment & data analysis layer: SNV, PCA, outlier detection, classification overlays
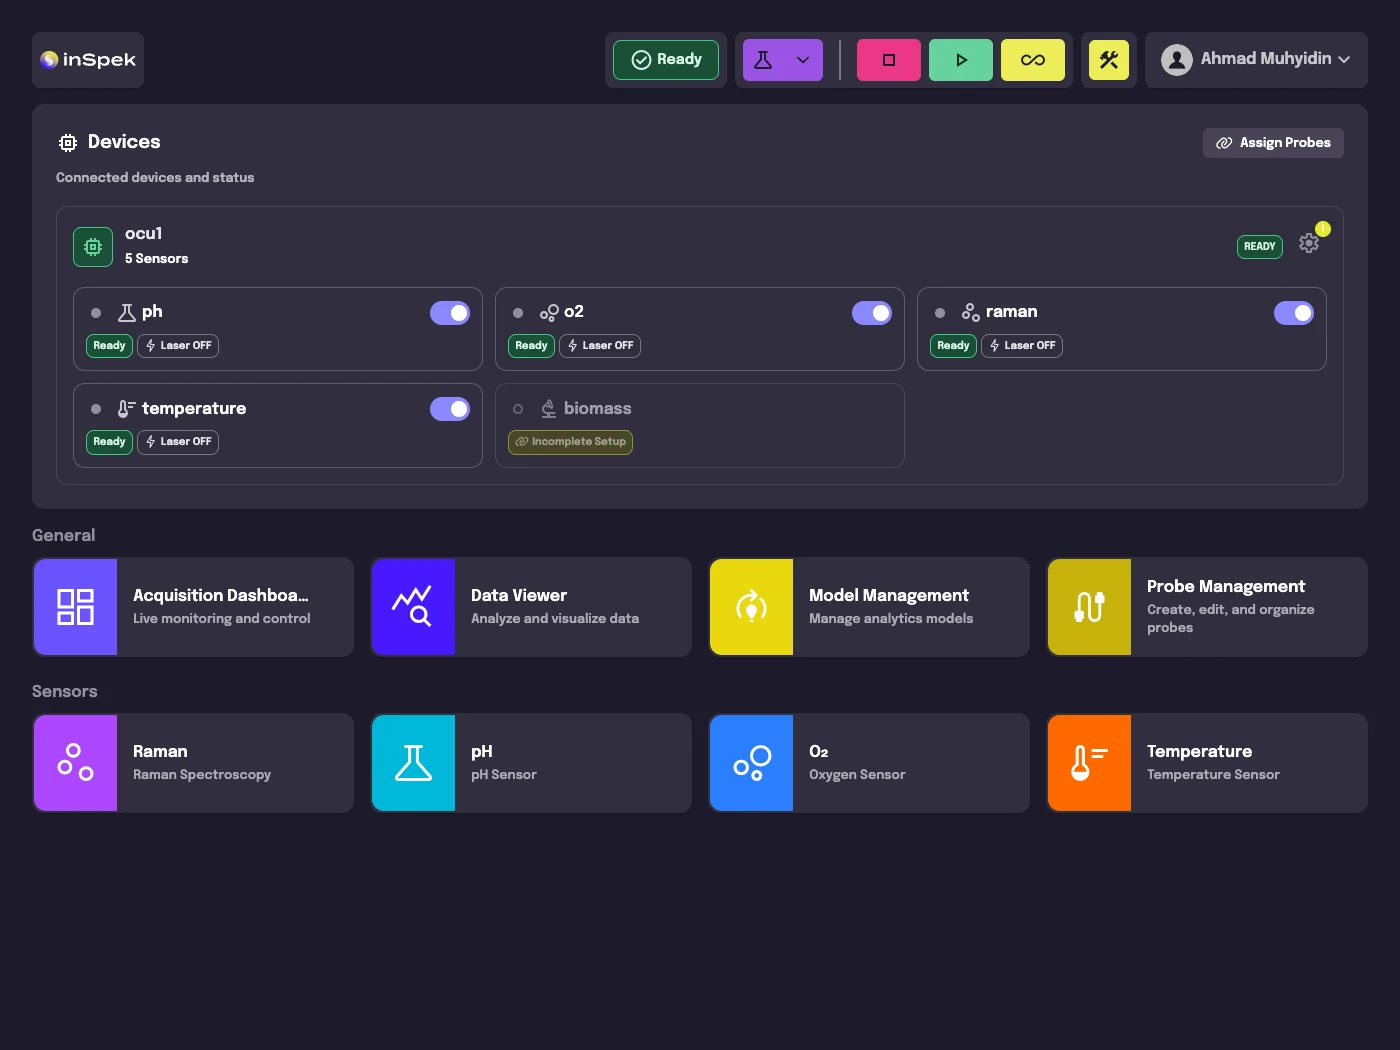
Multi-sensor platform: Raman, pH, O2, temperature, biomass operating in parallel
Live acquisition dashboard with real-time sensor visualization
Probe, model management + fit calibration + post-processing
The Problem
OCU coordinates multiple spectroscopy and sensor instruments — Raman, pH, O2, temperature, biomass — in a synchronized biopharmaceutical experiment environment. At v1.2, the experiment and data analysis layer needed to be built from scratch: a guided experiment wizard, a data explorer, and an advanced visualization toolkit covering the full spectrum analysis workflow (dark subtraction, SNV normalization, smoothing, outlier detection, PCA, classification overlays). At v2.0, the platform needed to expand to a true multi-sensor foundation — sensors running in parallel, live acquisition dashboards, probe and model management, fit calibration, post-processing, and annotation — alongside a full data model migration.
Constraints
- [01]Biopharmaceutical domain — data integrity and visualization accuracy are non-negotiable
- [02]Multi-sensor coordination — Raman, pH, O2, temperature, biomass must run in parallel with independent acquisition state
- [03]MQTT + WebSocket real-time pipeline — live sensor data must surface with minimal latency during acquisition
- [04]v2.0 data model migration — existing experiment data must be preserved and re-mapped without loss
- [05]Swiss engineering standards applied via Alpamayo — code quality, review, and documentation expectations are tight
- [06]Chart.js-based visualization toolkit — must handle large spectral datasets with interactive overlays cleanly
Our Approach
On v1.2, built the complete experiment and data analysis layer from scratch. The experiment wizard guides users through setup, sample grouping, and acquisition configuration. The data explorer provides a full spectral dataset browser. The advanced visualization toolkit covers dark subtraction, SNV (Standard Normal Variate) normalization, smoothing with moving average, outlier detection with marking, PCA (Principal Component Analysis), and classification overlays — each as interactive, composable overlays on the spectral chart. Implemented the supporting API transformations for all analysis operations.
On v2.0, led the UI side and contributed to the API across the full feature set: data model migration from v1.2 to v2.0 schema, multi-sensor foundation enabling Raman, pH, O2, temperature, and biomass sensors to run in parallel with independent acquisition state, live acquisition dashboard with real-time sensor visualization via MQTT and WebSocket, probe management, model management, fit calibration, post-processing pipeline, and annotation tooling.
Orchestrating multi-sensor spectroscopy equipment requires high-throughput real-time streaming (MQTT/WebSockets) and composition of advanced visualization algorithms on large datasets.
Gallery
Outcome
- Principal application-layer developer across v1.2 and v2.0
- Full experiment and data analysis layer shipped: SNV normalization, PCA, outlier detection, classification overlays, dark subtraction, smoothing
- Multi-sensor foundation live: Raman, pH, O2, temperature, and biomass sensors operating in parallel
- Live acquisition dashboard with real-time sensor visualization via MQTT and WebSocket
- Probe and model management, fit calibration, post-processing, and annotation tooling delivered in v2.0
Why this matters
Spectroscopy platforms live and die on the quality of their data visualization and sensor coordination. Building the full analysis layer — SNV, PCA, outlier detection, classification overlays — from scratch on v1.2 meant every visual decision mapped directly to how biopharma researchers interpret spectra. Scaling that to a parallel multi-sensor architecture on v2.0, without breaking existing experiment data, is the kind of work that requires both domain understanding and engineering discipline. Both were delivered.